2024
AIB has published the Residual Mixes and European Attribute Mix of 2024.
These figures represent the part of electricity supply in Europe that is not tracked with guarantees of origin and therefore guaranteeing the accuracy and reliability of the GO system. The calculation was carried out by Grexel Systems Ltd on behalf of AIB.
The 2024 calculation marks the sixth consecutive year in which the AIB Residual Mix calculation has been carried out according to the Shifted Issuing Based Methodology. Using this methodology, results continue to be consistent year-on-year. Regarding CO2 emissions, this year for the third time, the Ecoinvent data was used as input factors to replace the input emission factors calculated in the RE-DISS project.
Unlike in 2022 and 2023, the total electricity production rose, by 63 TWh in the calculation area mainly driven by increase of renewables by +114 TWh (+8%) and nuclear +30 TWh (+5%). Fossil production dropped by 81 TWh (-9%).
Energy tracking volumes continue to rise:
- Compared to 2023, the total recorded issuance volume was 940 TWh (EECS) and 730 TWh (national tracking systems), i.e. 1670 TWh, which is 7,5% more than in 2023.
- On the cancellation side, the total volume was 1 350 TWh in 2024, increasing 5% from 2023.
- Like last year, issuances were approximately 250 TWh more than cancellations and expiries together, which means that a significant share of 2024 production GOs were still active on 1 April 2025.
Issuance volume for renewable energy totalled 1480 TWh (+9% from 2023), which represents 90% of total RES production. The ratio between issuance and production is equal for 2023, which means RES tracking increased with similar velocity as RES production and only 10% of renewables are untracked within the calculation area.
All reported transaction volumes include also contract-based tracking, which is not based on certificates.
Highlighted results from the calculation:
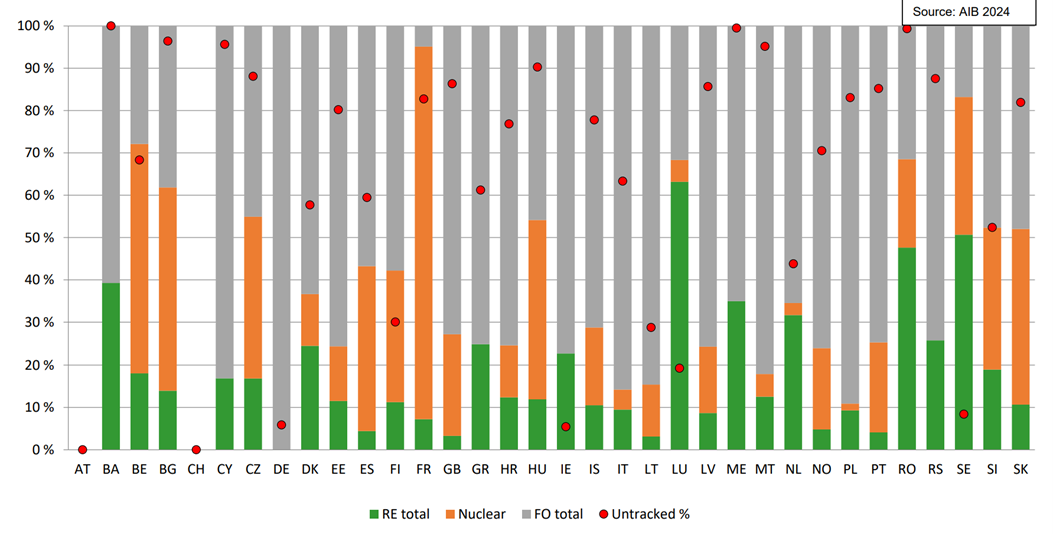
Average renewable share in the residual mixes was 18,3%, which is 4,8 percentage point (pp) more than in 2023. The main driver for the increase appears to be the rising tracking of non-RES attributes, while the ratio of tracked renewables compared to production remains similar. Also, the total figures do not tell the whole story as the ratio of RES tracking vs. production varies significantly per country.
The proportion of total electricity consumption tracked was 43,1%, i.e. slightly higher than the 41,8% in 2023, with 1 350 TWh of recorded cancellations.
The average CO2 content in residual mixes decreased by 42 gCO2/kWh (452 gCO2/kWh on average in all residual mixes).
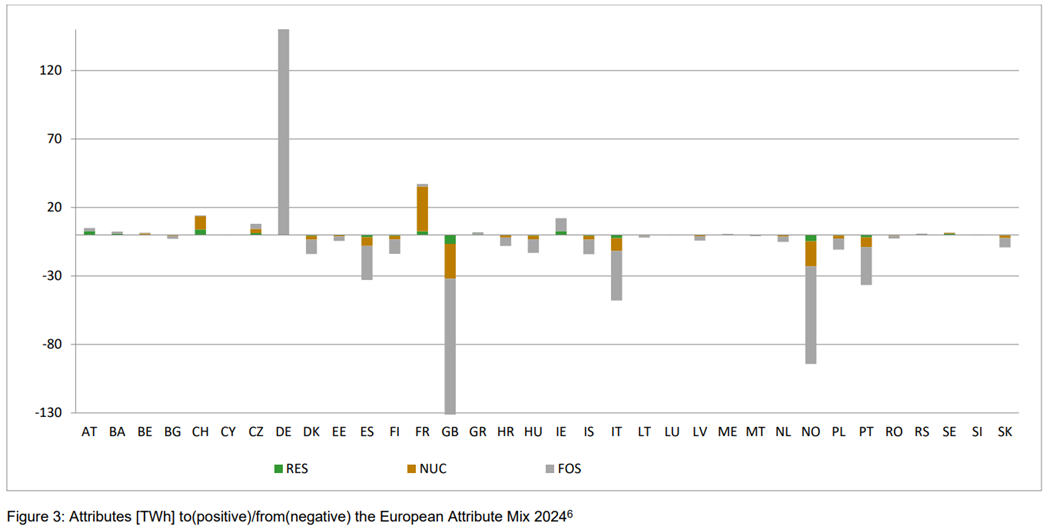
The European Attribute Mix for 2024 (comparison with 2023 in brackets):
- 4,94% renewable (+2,53 pp)
- 19,40% nuclear (+8,2 pp)
- 75,66% fossil (-10,73 pp)
- 536,94 gCO2/kWh (-62)
- 0,58 mgRW/kWh (+0,19)
This EAM fills a gap for countries that export such quantities of GOs that there are not sufficient domestic attributes left to determine the origin of all the domestic electricity consumption. The shares of energy sources in the EAM come from countries that import such quantities of GOs that they result in a domestic surplus of attributes compared to domestic electricity consumption.
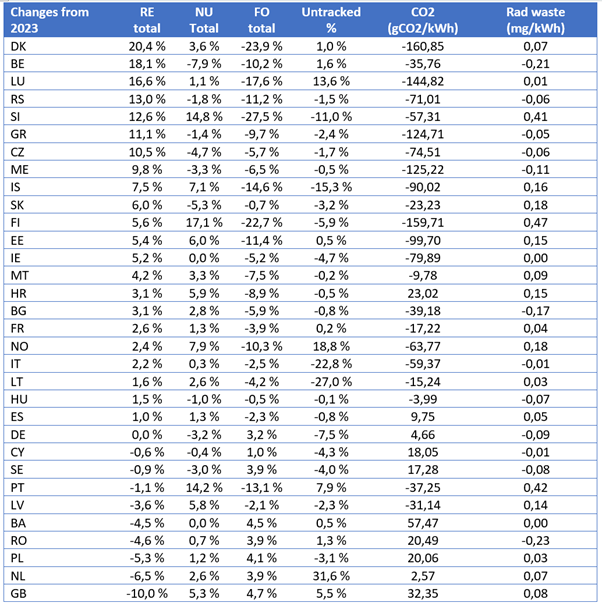
Country specific results:
The share of renewable energy in the residual mix decreased by over 10 pp in Great Britain, but rose by over 10 pp in 7 countries. The following table lists the changes in the residual mixes of 2024 vs. 2023. Please note that also for the column “untracked” the value indicates the percentage point change, not the absolute percentage of untracked consumption.
- Please see a detailed comparison of 2022, 2023, 2024 RMs in the report:
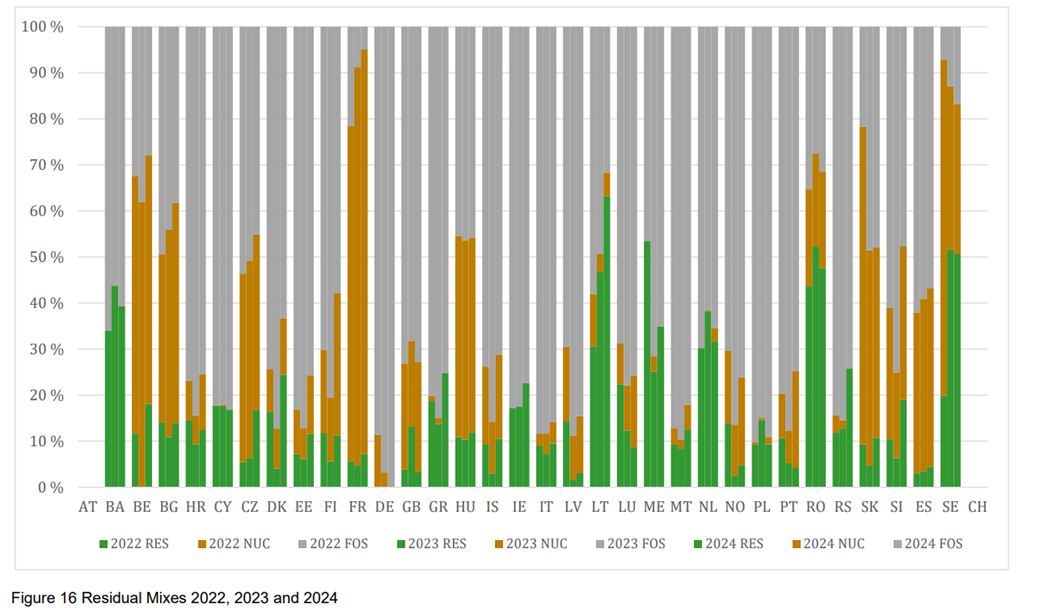
- Like last years, no residual mix was calculated for Austria and Switzerland due to full disclosure regimes.
- Close to all EECS countries had a large difference between the production and residual mix, which further exemplifies that most renewable attributes are explicitly tracked.
It should be noted that the rise of the renewable share in the residual mix is not necessarily and indication that the proportion of renewable tracking would have decreased. Yearly variation can also happen due known imperfections in the available data, most notably:
- Issuing transactions are based on transaction time (1.4-31.3) but physical data is based on the calendar year. This means that issuances are partly considered for wrong calendar years.
- Same applies on the cancellation side. GOs issued for production year X can continue to be used until the end of year X+1 due to the 12 months lifetime of GOs. Inevitably, cancellations are partly considered for the wrong consumption year.
The transaction based method guarantees however, that regardless of the overlap between years, all GO issuances are removed from the residual mix.
Download the full report for more insights.
Download Excel datasheet for numeric values (data to follow).
Widgets