
Activity statistics

These statistics are collected monthly from AIB Members and are normally published by the end of the following month.
This version of the statistics contains data on both EECS electricity and EECS gas GOs up to the end of September 2025. Some AIB Members already provided October 2025 data and those are included, but only a minority.

AIB is currently working on embedding our new Databricks statistics dashboards to our public website, scheduled for go-live in December 2025. For now you can find most important graphs below and full detail in the ZIP file in the right side grey panel on this page.

As a result of this project, we will change the format and structure of statistics data we publish on our website. We will embed the graphs and data tables directly and dynamically to our website. Our aim is to keep the level of detail and the scope of the data published on the same level as until now, but to enable automatisation and faster updates.

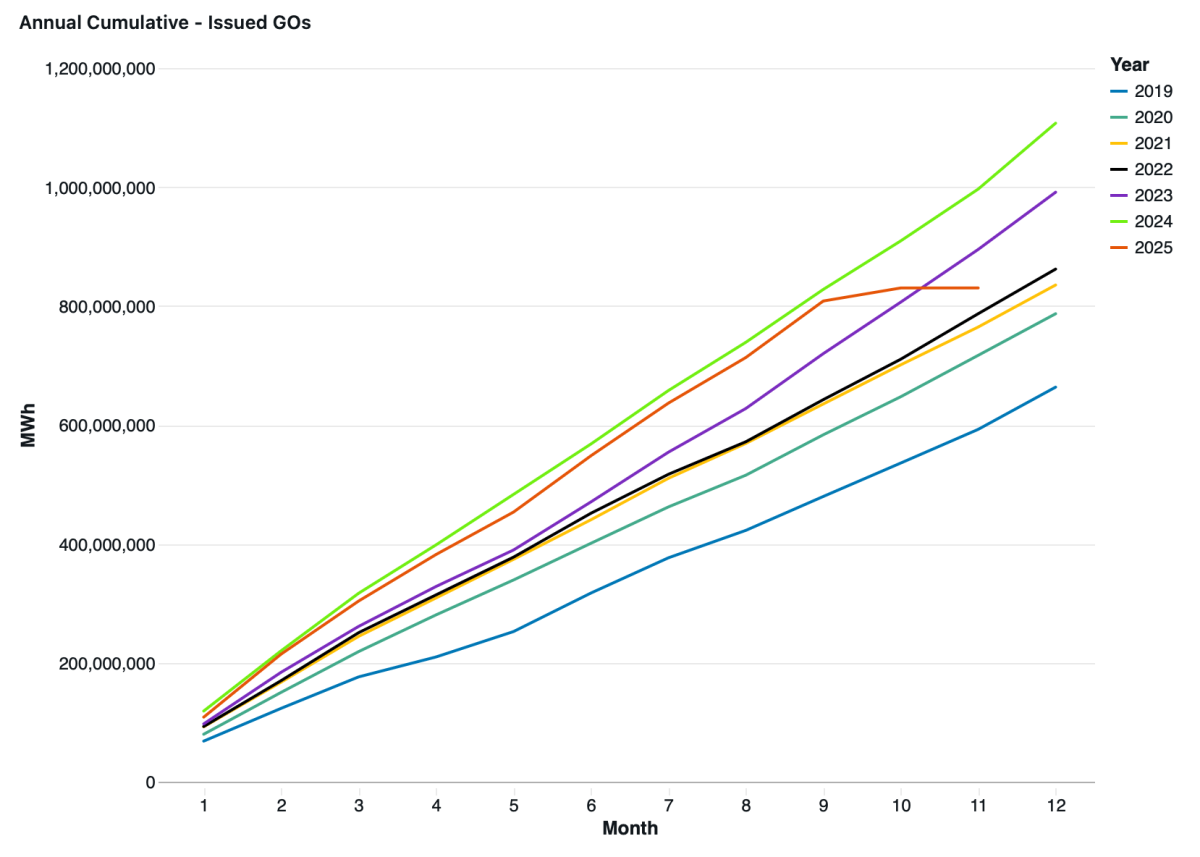
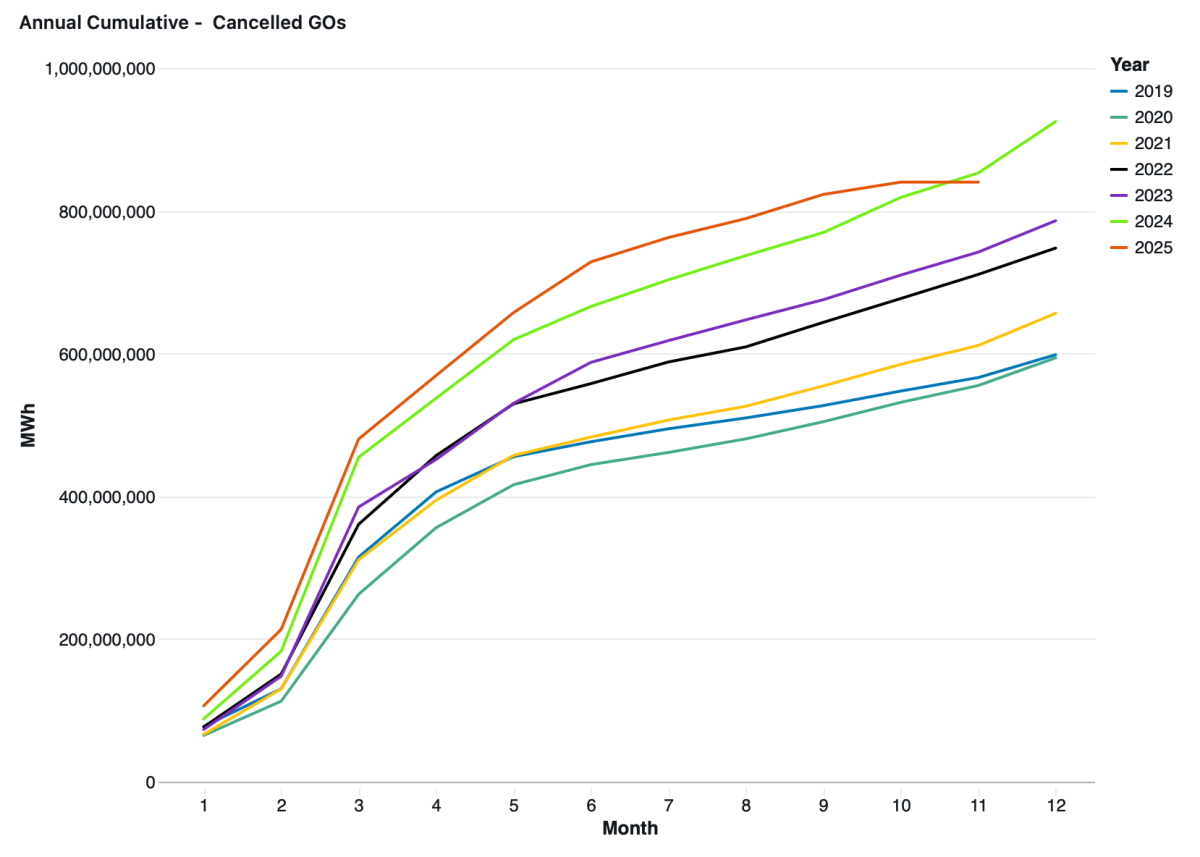
The following graphs display data on EECS electricity GOs:
» ELECTRICITY - The graph displays the total number of transactions per year, based on the year in which the transaction took place.
» ELECTRICITY - The cumulative number of issued EECS electricity GOs per year, based on the month in which the issuance took place.
» ELECTRICITY - The cumulative number of cancelled EECS electricity GOs per year, based on the month in which the cancellation took place.
» ELECTRICITY - The total number of transactions per year, based on the production year.
» ELECTRICITY - The total number of inter-domain transfers which successfully passed through the AIB Hub. Note that a single transfer often contains a large amount of certificates (GOs, MWh).
The following graphs display data on EECS gas GOs:
» GAS - The graph displays the total number of transactions per year, based on the year in which the transaction took place.
» GAS - The total number of inter-domain transfers which successfully passed through the AIB Hub. Note that a single transfer often contains a large amount of certificates (GOs, MWh).

AIB Statistics
Statistics - from January 2019 to end of September 2025 (ZIP compressed file with graphs and data tables)


Frequently asked questions:
What is the difference between “Production” statistics and “Transaction” statistics?
Production statistics refer to the month and year when the energy was produced, whereas Transaction statistics refer to the month and year when the transaction took place.

Is it possible to get access to the statistics in your previous format (Excel file with pivot tables)?
The previous format is no longer used, but the last version from March 2025 can be found here:

Statistics - from January 2019 to end of March 2025

Is it possible to get access to the statistics prior 2019?
The statistics and data prior 2019 are in different format and last such version from March 2021 can be found below (in that version the figures from 2019 onwards are not up to date):

Statistics - to end March 2021 v1