
2025
AIB has published the Residual Mixes and European Attribute Mix of 2025
Residual mixes represent the electricity consumption that is not explicitly tracked with Guarantees of Origin (GOs). They are an essential element of reliable electricity disclosure and help prevent double counting in the GO system.The European Energy Exchange carried out the calculation on behalf of AIB.
The standard 2025 calculation has been carried out according to the Shifted Issuing Based Methodology. Using this methodology, results continue to be consistent year-on-year. Regarding CO2 emissions, the Ecoinvent data was used as input factors for direct CO2 emissions from electricity production, where national values were not provided.
Overall, the overall production mix showed few changes comparing 2025 to 2024 at the level of the main fuel categoories: renewables, nuclear, and fossil. Electricity production from solar (+25%) and natural gas (+37%) rose, yet, which was offset by decline in other categories, mainly hydro, hard coal, and oil. Nuclear production remained constant.
Tracked electricity consumption volumes continue to rise:
- A total of 1 530 TWh of electricity consumption was explicitly tracked in 2025, which marks an impressive 13% growth. Over 1 000 TWh of these cancellations were EECS GOs and 524 TWh national GO and other reliable tracking systems.
- On the issuing side, the total recorded issuance volume was 1 100 TWh (EECS, +17%) and 510 TWh (national tracking systems, -31%), i.e., 1 620 TWh, which is 3% less than in 2024.
Issuance volume for renewable energy totalled 1 410 TWh (-5% from 2024), which represents 86% of total RES production. The ratio dropped slightly from 2024, meaning RES production rose faster than issuing. However, on the cancellation (demand) side, growth was 13% as mentioned.
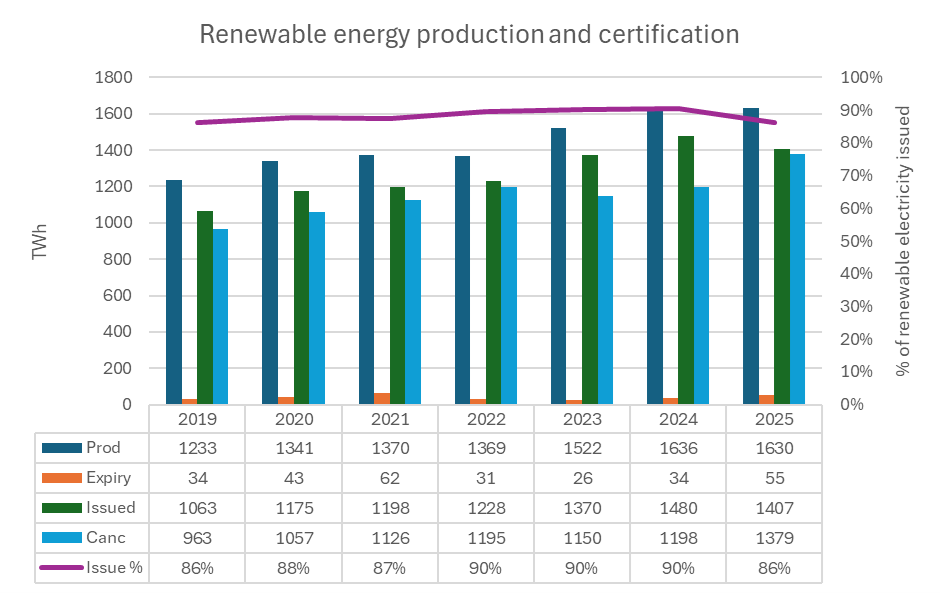
All reported transaction volumes also include contract-based tracking, which is not based on certificates.
Highlighted results from the calculation:
Average renewable share in the residual mixes amounted to 21 %, which continues a rising trend. Its main driver appears to be the rising tracking of non-RES attributes, while the ratio of tracked renewables compared to production remains similar. Also, the total figures do not tell the whole story, as the ratio of RES tracking vs. production varies significantly per country.
The proportion of total electricity consumption tracked was 49 %, i.e. up by 6% from 2024, with 1 530 TWh of recorded cancellations. This means an impressive nearly half of all European electricity consumption is explicitly tracked. Note that the red dot in the below graph shows untracked (not tracked) consumption percentage.
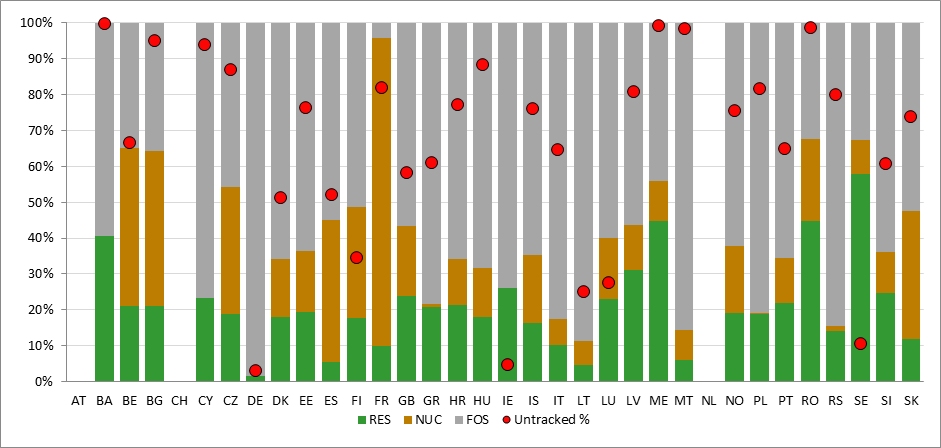
The average CO2 content in residual mixes decreased by 17 gCO2/kWh (435 gCO2/kWh on average in all residual mixes).
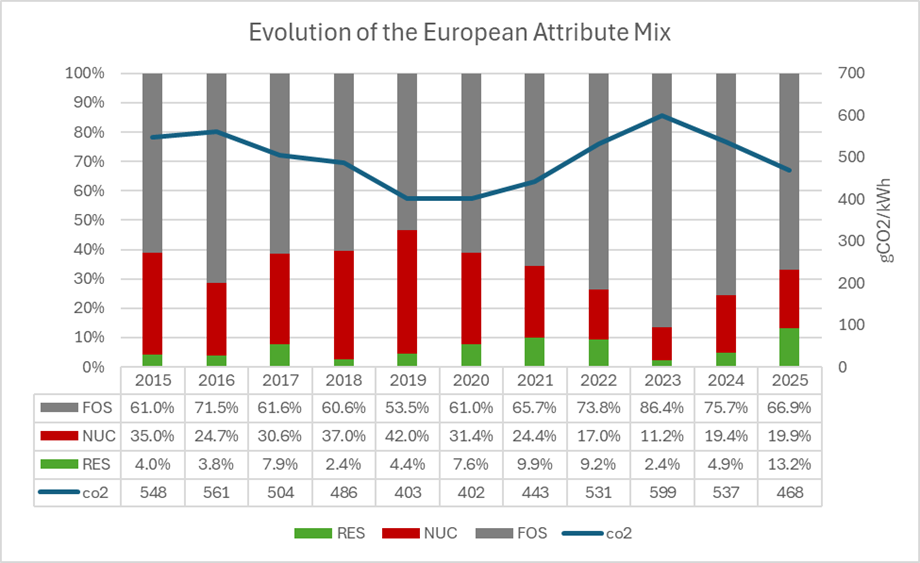
The European Attribute Mix (EAM) for 2025 is:
- 13,2 % renewable (+8,3 pp)
- 19,9 % nuclear (+0,5 pp)
- 66,9 % fossil (-8,7 pp)
- 468,4 gCO2/kWh (-68,5)
- 0,61 mgRW/kWh (+3)
pp = percentage point (value of 2025 minus 2024, i.e. not the percentual change from 2024 to 2025)
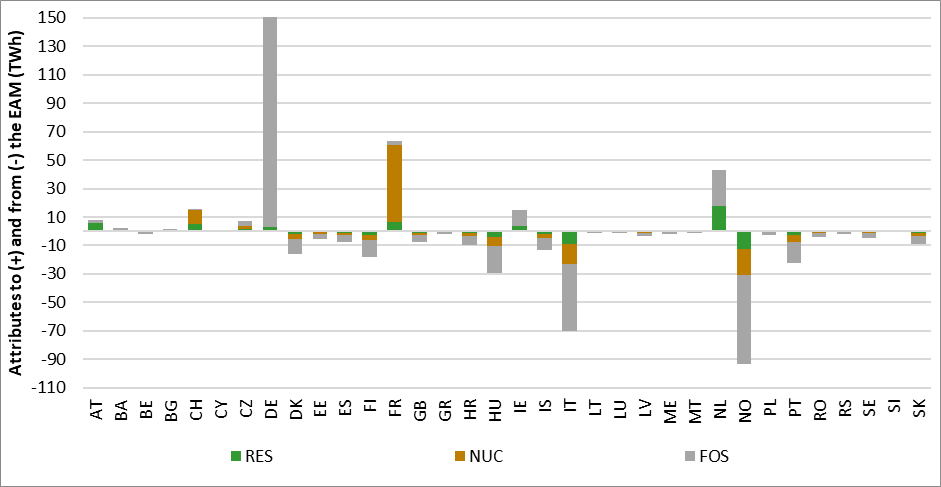
The European Attribute Mix (EAM) helps balance situations where countries export more GOs than the domestic electricity attributes available for disclosure. In such cases, the EAM is used to complement the residual mix so that the origin of all untracked electricity consumption can still be determined reliably.
The energy sources included in the EAM originate from countries that import large volumes of GOs and therefore retain a surplus of domestic electricity attributes compared to their own untracked consumption.
The following graph presents each country’s attribute surplus (to EAM) and deficit (from EAM). The contribution of full disclosure countries (AT, NL, CH) in the renewable energy content of the EAM is clearly visible. This could stem from e.g. domestic solar plants included in generation statistics, but not covered with GOs (this remains a working hypothesis)
The following graph presents the evolution of the EAM throughout its calculation history (Sumu, 2025)[1]. Surprisingly, this year marks the record RES content in the EAM.
[1] Credits from assembling the data for the graph for Saara Sumu 2025 (The Market for Guarantees of Origin: Mechanisms and Impact on Emissions, Master Thesis).
Country specific results:
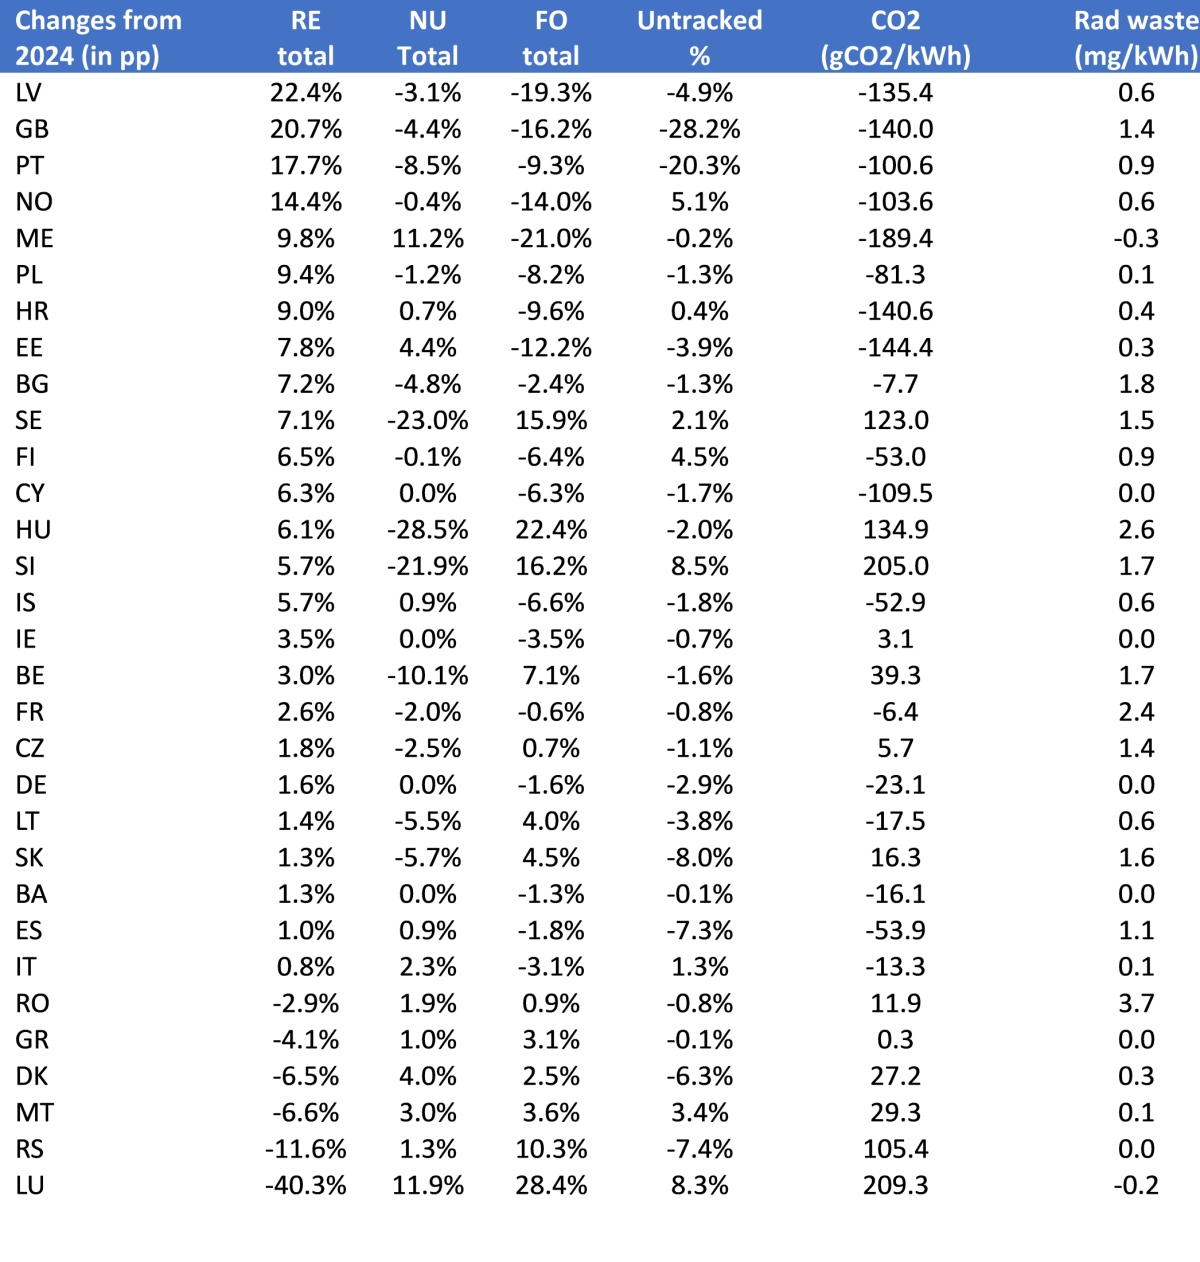
The share of renewable energy in the residual mix rose by over 10pp in Latvia, Great Britain, Portugal and Norway but decreased by over 10pp in Luxembourg and Serbia. The following table lists the changes in the residual mixes of 2025 vs. 2024. Please note that all changes are in percentage points, not percentages, while CO2 and radioactive waste describe the absolute change.
- As in previous years, no residual mix was calculated for Austria, the Netherlands and Switzerland due to full disclosure regimes.
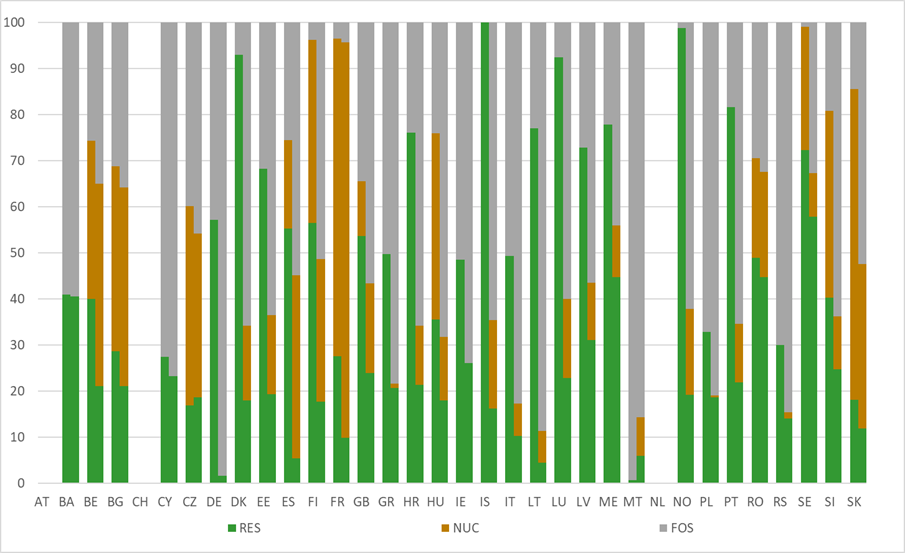
- Almost all EECS countries had a large difference between the production and residual mix, which further exemplifies that most renewable attributes are explicitly tracked. In the figure below, the left-hand column represents the production mix, while the right-hand column represents the residual mix.
- Finally, it should be noted that the rise of the renewable share in the residual mix is not necessarily an indication that the proportion of renewable tracking would have decreased. Year-to-year variation may partly result from timing differences between transaction-based GO data and calendar-year physical electricity data: Issuing transactions are based on transaction time (1.4-31.3), but physical data is based on the calendar year. This means that issuances are partly considered for the wrong calendar years.
- The same applies on the cancellation side. GOs issued for production year X can continue to be used until the end of year X+1 due to the 12-months lifetime of GOs. Inevitably, cancellations are partly considered for the wrong consumption year.
The transaction-time-based approach guarantees, however, that regardless of the overlap between years, all GO issuances are removed from the residual mix.
All in all the total surplus was about 10 TWh greater than the total deficit, which indicates a good attribute balance in the calculation. The difference results from:
- Total production (considering physical exchange with external countries not belonging to the EAM): 3 159 TWh
- Issuance: 1 623 TWh
- Expiry: 92 TWh
- Available attributes = 3 159 TWh – 1 623 TWh + 92 TWh = 1 630 TWh
- Consumption: 3 147 TWh
- Cancellations: 1 528 TWh
- Untracked consumption = 1 619 TWh
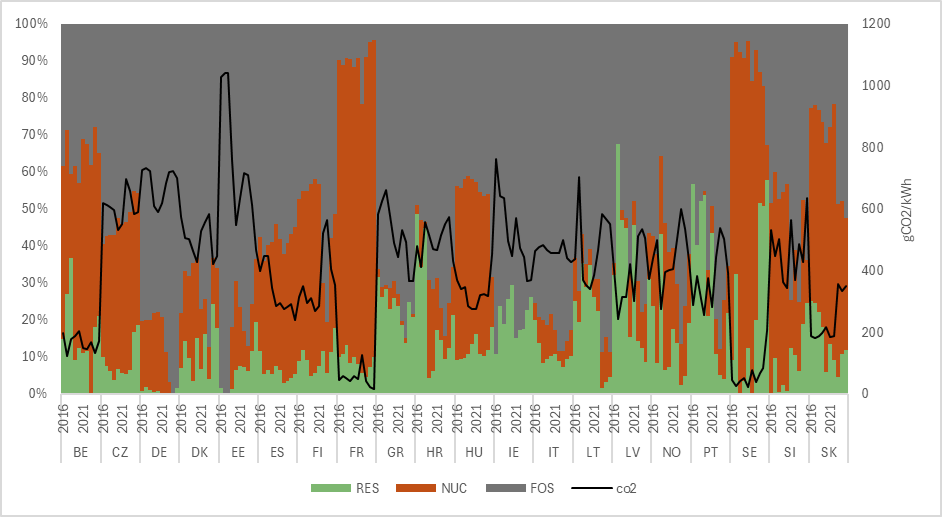
The last graph provides a longer outlook for the evolution of the residual mixes by country from 2016 to 2025[1].
[1] Credits from assembling the data for the graph for Saara Sumu 2025 (The Market for Guarantees of Origin: Mechanisms and Impact on Emissions, Master Thesis).
Download the full report for more insights.
Download Excel datasheet for numeric values (data to follow).
Widgets